Math Bar Charts: Turn Bar Heights into Numbers and Answer Data Questions
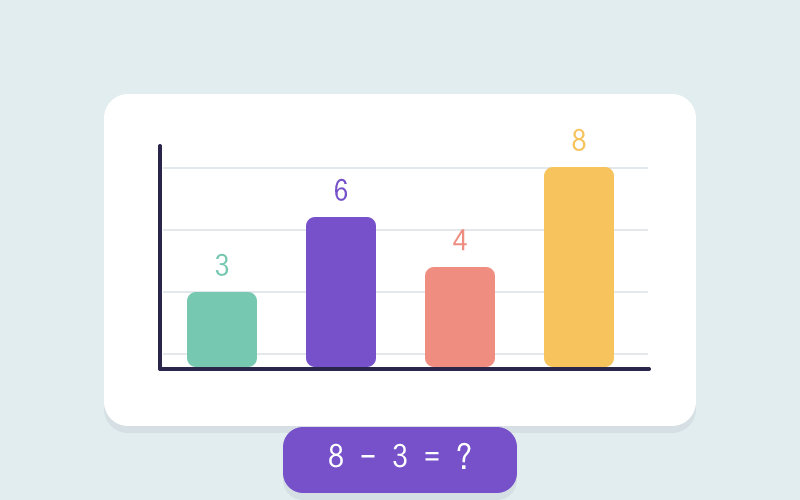
Tap the colored bar a question points to, then read its label and height as a real quantity. Each card pushes you past 'which bar is tallest' into comparing, subtracting, and totaling the data.
Spotting the Tallest Bar Won't Answer 'How Many More'
Most third graders can point to the tallest colored bar in a second, yet freeze when the card asks how many more cats than dogs the class owns. The sticking point is treating the picture as a ranking instead of a set of numbers you can subtract. Here every bar carries a visible value label, so tapping two bars lines their heights up against the same scale and the difference becomes something you count, not guess. When a question shifts to a total, you add the labelled values across bars, regrouping into the tens place when the ones column fills up, instead of eyeballing the picture. Reading the graph turns into arithmetic you can defend.
From Picture Graphs to Scaled-Bar Data Reasoning in Grades 3-4
This game sits on 3.MD.B.3, where students draw and interpret scaled bar graphs, and leans on the 2.MD.D.10 picture-graph work that comes before it. The compare-and-total questions feed directly into fourth-grade data lines and the line-plot reasoning of 4.MD.B.4. Students who can pull a difference straight off two labelled bars are ready to read heavier data sets without losing the numbers behind the picture.
Three Data Skills Practiced While Reading Colored Bars
- Read bar values: connect height and labels with actual quantities.
- Compare two categories: answer more, fewer, and difference questions.
- Combine data across bars: find totals or explain what the chart shows.
Three Moves to Read the Chart: Look, Compare, Answer
- Read the label and height of each colored bar.
- Use the question card to compare categories, find a difference, or calculate a total.
- Choose the answer and check it against the bar data.
Five-Minute Teacher Routine: Turn Colored Bars into Data Talk
Have students collect a tiny class data set and draw a simple bar graph. Making one chart makes later interpretation much more concrete.
Math Bar Charts Questions Teachers Ask About Graph Reading
Q: Why does my student know the tallest bar but miss the question?
A: Many graph questions ask for differences or totals. Students need to translate bar height into numbers before comparing or calculating.
Q: How can I tell if students understand the graph?
A: Ask which bars they used and what values they read. Explaining the data source is a stronger check than choosing an answer only.