Stats Arcade: Compute Mean, Median, Mode, and Range to Beat Each Round
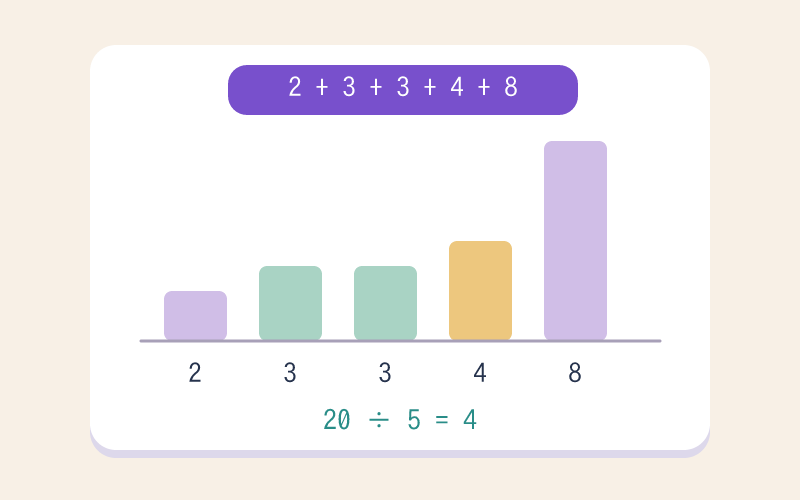
Drag arcade scores onto the number line, then read how the mean, median, mode, and range respond. Each round trains you to pick the measure that truly describes the data.
When One Outlier Drags the Mean but Leaves the Median Steady
Students often treat mean, median, and mode as interchangeable until a single extreme score pulls the average away from where most of the data actually sits. In Stats Arcade you drag scores onto the number line and watch the mean marker slide while the median holds its ground, making the difference visible instead of memorized. When a new high score lands, you infer which summary still describes the typical player. The range bar stretches at the same time, forcing a decision about whether spread or center tells the real story. That contrast is exactly where the concept finally clicks.
From Tallying Arcade Scores to Judging Which Average Fits (Grades 4-7)
Line plots and running totals from grade 4-5 are the starting point, and dragging arcade scores onto the number line carries that data-reading skill into the formal statistics of grade 6. Learners connect earlier line-plot reading (4.MD.B.4) to computing measures of center and variability (6.SP.A.3, 6.SP.B.5.c), then extend to comparing whole data distributions in grade 7 (7.SP.B.4). Recognizing when the median beats the mean is the bridge to later work on sampling and inference.
Learning Points
- data collection
- graph representation
- measures of center
- theoretical and experimental probability
Steps and completion rules
- Read which statistic is requested, then list every value in the set.
- Use total divided by count for mean, sort for median, count repeats for mode, or subtract minimum from maximum for range.
- Choose the result and finish the set, noting why the four statistics can differ.
Teacher / Parent Note
Ask for one line of calculation or sorting evidence. The tallest bar is not automatically the answer to every statistics question.