Cause or Coincidence?: Sort Data Evidence and Rewrite the Overclaim
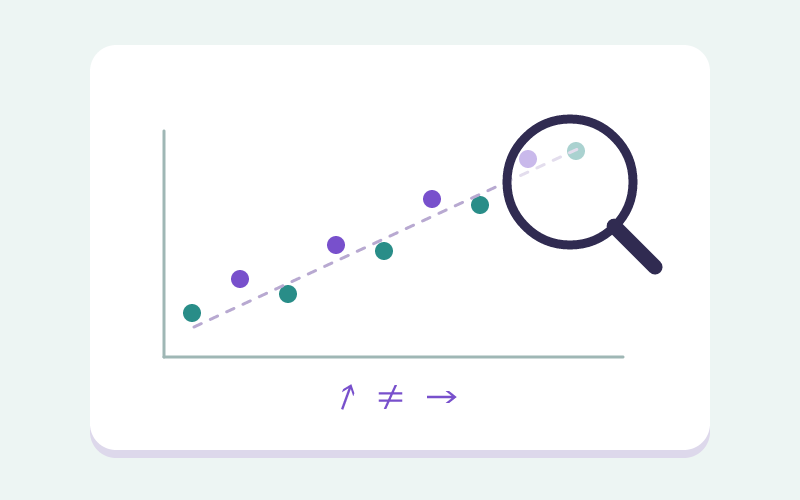
Each level drops a fictional data case in front of you: sort its evidence into one of four strength buckets, defend the reason, and rewrite an overclaim. It trains the habit of asking what a pattern can honestly support before you assert cause.
A Rising Scatterplot Feels Like Proof — Until You Hunt the Third Factor
Most students watch two variables climb together and jump straight to 'A causes B.' Where they stall is separating a genuine pattern from a confounder, or from a sample too thin to back any claim at all. Each case shows a visible scatterplot and point table, and you drop your judgment into one of four buckets — association, bounded cause, confounded, or insufficient — before naming the reason that decides it. The reveal exposes the hidden third factor and how the study was set up, so the slogan 'correlation is not causation' turns into a concrete sorting move. The mandatory final challenge hands you an overstated headline to rewrite until the wording actually fits the evidence.
Doubting a Confident Headline Is Grade 6-8 Statistics
It fits students who can already read a graph and paired data (6.SP.A.1) and are moving into bivariate association on scatterplots (8.SP.A.1, 8.SP.A.2). The classifying and headline-rewrite work bridges that reading skill toward weighing confounders, sample scope, and the strength of a conclusion — the reasoning that later supports 8.SP.A.3 interpretation and any experimental-design discussion.
Four Evidence-Reasoning Moves Practiced With Each Case
- Describe visible data and scatterplot patterns before making a claim beyond the chart.
- Distinguish association, bounded causation, confounding, and insufficient evidence.
- Select the experimental setup, third factor, or scope detail that supports the classification.
- Rewrite an overclaim with association, uncertainty, or bounded causal language.
Four Steps: Read, Classify, Justify, Rewrite
- Read the fictional case and inspect the scatterplot and point table; if the chart is covered, predict first or reveal the data clue.
- In solo mode, choose an evidence classification and reason. In classroom mode, record only aggregate votes for each option.
- Reveal the intended interpretation and debrief the visible third factor and discussion prompt.
- After all levels, use the final challenge to rewrite one overstated causal headline as a claim limited by the available evidence.
Teacher Use: Debrief the Vote Gap, Then Rewrite the Overclaim
For whole-class Cause or Coincidence? play, record only aggregate option counts. After each level, ask two groups to explain the plurality choice and the intended reading. Debrief the third factor, assignment method, or missing evidence, then use the mandatory final challenge to check whether students can rewrite the headline and narrow the claim independently.
Play and rules
Read a fictional case, inspect its chart and point table, and choose the strongest conclusion the evidence supports. Then identify the setup detail, third factor, or missing evidence behind that conclusion.
Modes and difficulty
Select Grade 6, 7, or 8 to change case complexity and the support provided. Classroom mode displays aggregate option counts for a teacher-led discussion.
Practice connections
The final challenge asks you to rewrite an overstated causal headline. Name the measured relationship and limit the claim to what the available evidence supports.